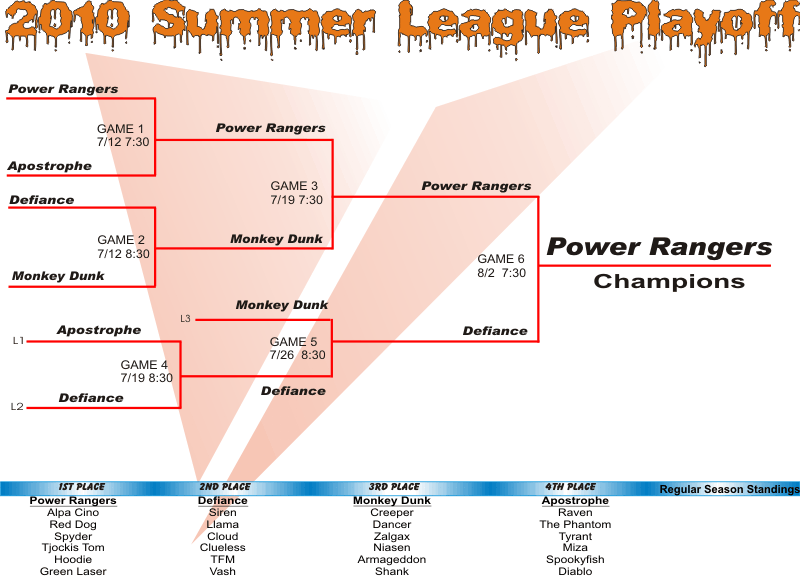
MVP Ratio Statistics Playoff History Playoff
Chart in PDF

Playoff Statistics
|
MVP |
|
Hit |
|
Player Hits |
|
Player Hits |
|
Arena Hits |
|
Games |
|
Rank |
|
Nick Name |
Ratio |
|
Ratio |
|
Given |
|
Taken |
|
Given |
|
Shots |
|
Accuracy |
|
Played |
|
1 |
|
Red Dog |
26.5 |
|
20.7 |
|
252 |
|
128 |
|
7 |
|
4069 |
|
6.37% |
|
6 |
|
2 |
|
Zalgax |
14.3 |
|
-3.2 |
|
145 |
|
164 |
|
21 |
|
1649 |
|
10.07% |
|
6 |
|
3 |
|
Spyder |
11.0 |
|
11.0 |
|
185 |
|
119 |
|
0 |
|
4346 |
|
4.26% |
|
6 |
|
4 |
|
Clueless |
10.7 |
|
10.7 |
|
151 |
|
87 |
|
0 |
|
1867 |
|
8.09% |
|
6 |
|
5 |
|
Dancer |
8.0 |
|
8.0 |
|
196 |
|
148 |
|
0 |
|
3565 |
|
5.50% |
|
6 |
|
6 |
|
Green Laser |
6.0 |
|
6.0 |
|
143 |
|
107 |
|
0 |
|
2555 |
|
5.60% |
|
6 |
|
7 |
|
Tjockis Tom |
4.0 |
|
4.0 |
|
123 |
|
99 |
|
0 |
|
4638 |
|
2.65% |
|
6 |
|
8 |
|
Cloud |
3.3 |
|
-3.0 |
|
222 |
|
246 |
|
10 |
|
3393 |
|
6.84% |
|
8 |
|
9 |
|
Hoodie |
3.2 |
|
-1.8 |
|
145 |
|
156 |
|
6 |
|
3063 |
|
4.93% |
|
6 |
|
10 |
|
Miza |
3.0 |
|
-7.0 |
|
116 |
|
144 |
|
8 |
|
2478 |
|
5.00% |
|
4 |
|
11 |
|
Llama |
1.5 |
|
-6.0 |
|
249 |
|
297 |
|
12 |
|
4148 |
|
6.29% |
|
8 |
|
12 |
|
Armageddon |
0.7 |
|
0.7 |
|
99 |
|
95 |
|
0 |
|
2940 |
|
3.37% |
|
6 |
|
13 |
|
Diablo |
0.0 |
|
0.0 |
|
0 |
|
0 |
|
0 |
|
1 |
|
0.00% |
|
0 |
|
14 |
|
The Phantom |
-1.0 |
|
-3.5 |
|
78 |
|
92 |
|
2 |
|
1080 |
|
7.41% |
|
4 |
|
15 |
|
Tyrant |
-1.0 |
|
-1.0 |
|
82 |
|
86 |
|
0 |
|
1416 |
|
5.79% |
|
4 |
|
16 |
|
Alpa Cino |
-1.3 |
|
-3.0 |
|
93 |
|
111 |
|
2 |
|
1573 |
|
6.04% |
|
6 |
|
17 |
|
Siren |
-2.3 |
|
-3.5 |
|
86 |
|
100 |
|
1 |
|
1310 |
|
6.64% |
|
4 |
|
18 |
|
Shank |
-2.5 |
|
-2.5 |
|
43 |
|
53 |
|
0 |
|
1395 |
|
3.08% |
|
4 |
|
19 |
|
Raven |
-5.8 |
|
-5.8 |
|
81 |
|
104 |
|
0 |
|
1412 |
|
5.74% |
|
4 |
|
20 |
|
Tax Fraud Mike |
-6.8 |
|
-6.8 |
|
57 |
|
98 |
|
0 |
|
2089 |
|
2.73% |
|
6 |
|
Tuesday, August 03, 2010 |
Page 1 of 1 |
top


