MVP Ratio Statistics Playoff History Playoff
Chart in PDF
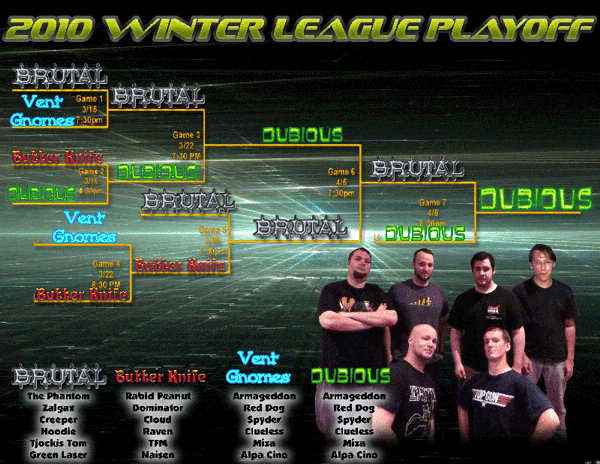
Playoff Statistics
top
|
MVP |
|
Hit |
|
Player Hits |
|
Player Hits |
|
Arena Hits |
|
Games |
|
Rank |
|
Nick Name |
Ratio |
|
Ratio |
|
Given |
|
Taken |
|
Given |
|
Shots |
|
Accuracy |
|
Played |
|
1 |
|
Red Dog |
20.3 |
|
17.1 |
|
316 |
|
179 |
|
5 |
|
6574 |
|
4.88% |
|
8 |
|
2 |
|
Zalgax |
6.2 |
|
-0.8 |
|
179 |
|
187 |
|
14 |
|
2411 |
|
8.00% |
|
10 |
|
3 |
|
The Phantom |
4.1 |
|
3.1 |
|
230 |
|
199 |
|
2 |
|
4336 |
|
5.35% |
|
10 |
|
4 |
|
Clueless |
2.8 |
|
2.8 |
|
75 |
|
53 |
|
0 |
|
1617 |
|
4.64% |
|
8 |
|
5 |
|
Dominator |
2.7 |
|
0.2 |
|
121 |
|
120 |
|
3 |
|
1698 |
|
7.30% |
|
6 |
|
6 |
|
Armageddon |
2.1 |
|
2.1 |
|
92 |
|
75 |
|
0 |
|
2303 |
|
3.99% |
|
8 |
|
7 |
|
Tjockis Tom |
1.3 |
|
1.3 |
|
101 |
|
88 |
|
0 |
|
6003 |
|
1.68% |
|
10 |
|
8 |
|
Cloud |
1.0 |
|
-0.7 |
|
147 |
|
151 |
|
2 |
|
2961 |
|
5.03% |
|
6 |
|
9 |
|
Raven |
1.0 |
|
1.0 |
|
67 |
|
61 |
|
0 |
|
1321 |
|
5.07% |
|
6 |
|
10 |
|
Tax Fraud Mike |
1.0 |
|
1.0 |
|
37 |
|
31 |
|
0 |
|
1851 |
|
2.00% |
|
6 |
|
11 |
|
Captain Enthusiasm |
0.8 |
|
-0.5 |
|
82 |
|
84 |
|
1 |
|
1882 |
|
4.41% |
|
4 |
|
12 |
|
Rabid Peanut |
0.0 |
|
0.0 |
|
116 |
|
116 |
|
0 |
|
2746 |
|
4.22% |
|
6 |
|
13 |
|
Spyder |
-0.3 |
|
-1.2 |
|
54 |
|
61 |
|
1 |
|
1707 |
|
3.22% |
|
6 |
|
14 |
|
Hoodie |
-1.1 |
|
-1.6 |
|
124 |
|
140 |
|
1 |
|
3139 |
|
3.98% |
|
10 |
|
15 |
|
Llama |
-1.5 |
|
-5.3 |
|
104 |
|
125 |
|
3 |
|
1492 |
|
7.17% |
|
4 |
|
16 |
|
Alpa Cino |
-1.9 |
|
-1.9 |
|
145 |
|
160 |
|
0 |
|
2692 |
|
5.39% |
|
8 |
|
17 |
|
Creeper |
-2.6 |
|
-5.1 |
|
186 |
|
237 |
|
5 |
|
3478 |
|
5.49% |
|
10 |
|
18 |
|
Siren |
-2.8 |
|
-2.8 |
|
74 |
|
85 |
|
0 |
|
1810 |
|
4.09% |
|
4 |
|
19 |
|
Miza |
-4.5 |
|
-5.3 |
|
87 |
|
119 |
|
1 |
|
1715 |
|
5.13% |
|
6 |
|
20 |
|
Jubei |
-4.8 |
|
-4.8 |
|
23 |
|
42 |
|
0 |
|
1123 |
|
2.05% |
|
4 |
|
Tuesday, April 06, 2010 |
Page 1 of 1 |


