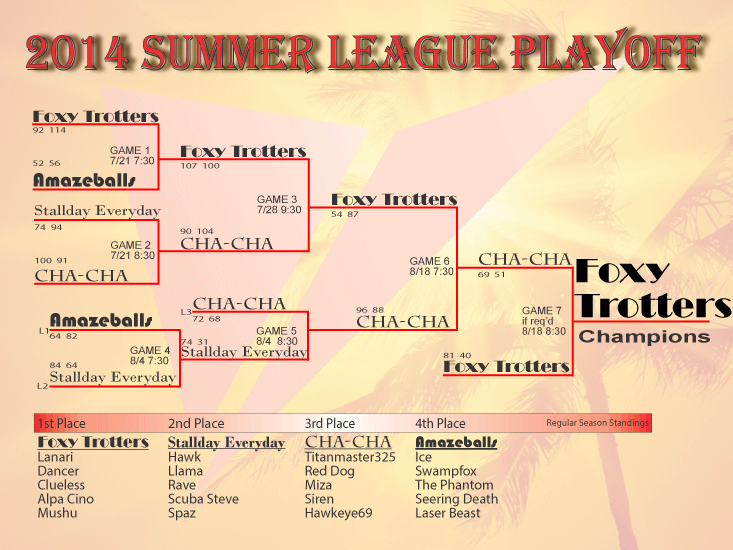
MVP Ratio Statistics Playoff History Playoff
Chart in PDF Regular Season Schedule

Playoff Statistics
|
MVP |
|
Hit |
|
Player Hits |
|
Player Hits |
|
Arena Hits |
|
Games |
|
Rank |
|
Nick Name |
Ratio |
|
Ratio |
|
Given |
|
Taken |
|
Given |
|
Shots |
|
Accuracy |
|
Played |
|
1 |
|
Dancer |
12.9 |
|
12.3 |
|
239 |
|
141 |
|
1 |
|
3087 |
|
7.77% |
|
8 |
|
2 |
|
Red Dog |
12.8 |
|
9.8 |
|
292 |
|
194 |
|
6 |
|
4643 |
|
6.42% |
|
10 |
|
3 |
|
Spaz |
1.3 |
|
1.3 |
|
32 |
|
27 |
|
0 |
|
544 |
|
5.88% |
|
4 |
|
4 |
|
Alpa Cino |
1.1 |
|
1.1 |
|
143 |
|
134 |
|
0 |
|
1514 |
|
9.45% |
|
8 |
|
5 |
|
Lanari |
0.5 |
|
0.5 |
|
87 |
|
83 |
|
0 |
|
1243 |
|
7.00% |
|
8 |
|
6 |
|
Hawk |
-0.3 |
|
-1.5 |
|
100 |
|
106 |
|
1 |
|
3331 |
|
3.03% |
|
4 |
|
7 |
|
Swampfox |
-0.8 |
|
-0.8 |
|
74 |
|
77 |
|
0 |
|
1071 |
|
6.91% |
|
4 |
|
8 |
|
Ice |
-2.3 |
|
-2.3 |
|
63 |
|
72 |
|
0 |
|
1591 |
|
3.96% |
|
4 |
|
9 |
|
Titanmaster 325 |
-2.3 |
|
-2.8 |
|
157 |
|
185 |
|
1 |
|
2271 |
|
6.96% |
|
10 |
|
10 |
|
Llama |
-3.8 |
|
-3.8 |
|
97 |
|
112 |
|
0 |
|
1510 |
|
6.42% |
|
4 |
|
11 |
|
Mushu |
-3.9 |
|
-3.9 |
|
62 |
|
93 |
|
0 |
|
2065 |
|
3.00% |
|
8 |
|
12 |
|
Scuba Steve |
-4.0 |
|
-4.0 |
|
55 |
|
67 |
|
0 |
|
981 |
|
5.61% |
|
3 |
|
13 |
|
The Phantom |
-5.8 |
|
-5.8 |
|
68 |
|
91 |
|
0 |
|
1199 |
|
5.67% |
|
4 |
|
14 |
|
Laser Beast |
-6.0 |
|
-6.0 |
|
8 |
|
20 |
|
0 |
|
90 |
|
8.89% |
|
2 |
|
15 |
|
Hawkeye69 |
-6.3 |
|
-6.3 |
|
21 |
|
65 |
|
0 |
|
1046 |
|
2.01% |
|
7 |
|
16 |
|
Seering Death |
-7.8 |
|
-7.8 |
|
37 |
|
68 |
|
0 |
|
918 |
|
4.03% |
|
4 |
|
Monday, August 18, 2014 |
Page 1 of 1 |
top


