


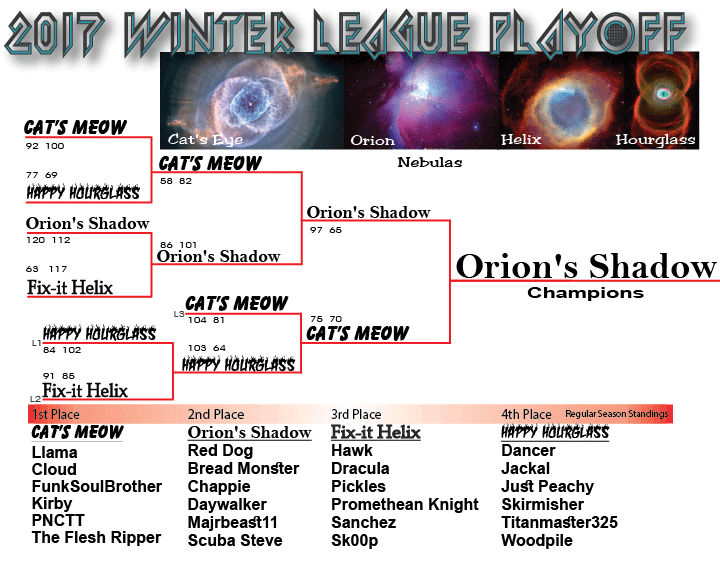
MVP Ratio Statistics Playoff History Regular Season Schedule
Playoff Statistics
Rank |
Nickname |
MVP Ratio |
Hit Ratio |
Total Hits Given |
Total Hits Taken |
Arena Hits Given |
Shots |
Accuracy | Games Played |
|---|---|---|---|---|---|---|---|---|---|
1 |
Red Dog | 16.70 |
16.70 |
190 |
90 |
0 |
2283 |
8.32% |
6 |
2 |
Chappie | 8.20 |
8.20 |
128 |
79 |
0 |
1983 |
6.45% |
6 |
3 |
Kirby | 7.80 |
7.80 |
171 |
109 |
0 |
2984 |
5.73% |
8 |
4 |
FunkSoulBrother | 2.60 |
2.60 |
77 |
56 |
0 |
2067 |
3.73% |
8 |
5 |
Cloud | 2.50 |
-3.30 |
117 |
137 |
7 |
2247 |
5.52% |
6 |
6 |
Dancer | 2.30 |
2.30 |
144 |
130 |
0 |
2091 |
6.89% |
6 |
7 |
Jackal | 2.20 |
2.20 |
72 |
59 |
0 |
1290 |
5.58% |
6 |
8 |
Titanmaster 325 | 0.20 |
-0.70 |
138 |
142 |
1 |
1394 |
9.97% |
6 |
9 |
Daywalker | -0.70 |
-3.20 |
83 |
102 |
3 |
791 |
10.87% |
6 |
10 |
Sk00p | -1.50 |
-1.50 |
46 |
52 |
0 |
1140 |
4.04% |
4 |
11 |
Skirmisher | -2.00 |
-2.00 |
19 |
31 |
0 |
300 |
6.33% |
6 |
12 |
Just Peachy | -2.00 |
-2.00 |
12 |
16 |
0 |
518 |
2.32% |
2 |
13 |
Majrbeast11 | -2.80 |
-2.80 |
35 |
46 |
0 |
429 |
8.16% |
4 |
14 |
The Flesh Ripper | -3.20 |
-3.20 |
51 |
77 |
0 |
947 |
5.39% |
8 |
15 |
Woodpile | -3.30 |
-3.30 |
110 |
130 |
0 |
4020 |
2.74% |
6 |
16 |
Bread Monster | -3.30 |
-3.30 |
27 |
47 |
0 |
945 |
2.86% |
6 |
17 |
Promethean Knight | -3.50 |
-3.50 |
26 |
40 |
0 |
559 |
4.65% |
4 |
18 |
Sweet Pea | -4.40 |
-4.40 |
66 |
101 |
0 |
1627 |
4.06% |
8 |
19 |
Dracula | -7.50 |
-7.50 |
73 |
103 |
0 |
1241 |
5.88% |
4 |
20 |
Sanchez | -8.50 |
-12.20 |
59 |
108 |
3 |
2095 |
2.96% |
4 |